Summarize the information by selecting and reporting the main features and make comparisons where relevant.
There are three basic things you need to structure an IELTS writing task 1.
- Introduce the graph
- Give an overview
- Give the detail
We’ll look at each of these in turn.
1) Introduce the Graph
You need to begin with one or two sentences that state what the IELTS writing task 1 shows. To do this, paraphrase the title of the graph, making sure you put in a time frame if there is one.
Here is an example for the above line graph:
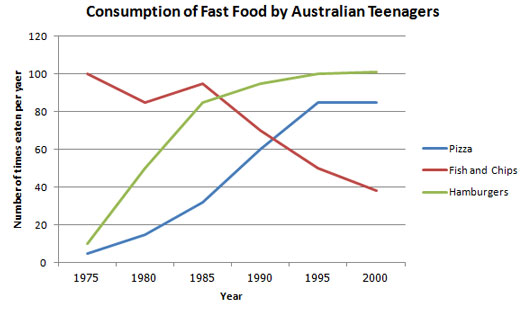
The line graph illustrates the amount of fast food consumed by teenagers in Australia between 1975 and 2000, a period of 25 years.
You can see this says the same thing as the title, but in a different way.
2) Give an Overview
You also need to state what the main trend or trends in the graph are. Don’t give detail such as data here – you are just looking for something that describes what is happening overall.
One thing that stands out in this graph is that one type of fast food fell over the period, whilst the other two increased, so this would be a good overview.
Here is an example:
Overall, the consumption of fish and chips declined over the period, whereas the amount of pizza and hamburgers that were eaten increased.
This covers the main changes that took place over the whole period.
You may sometimes see this overview as a conclusion. It does not matter if you put it in the conclusion or the introduction when you do an IELTS writing task 1, but you should provide an overview in one of these places.
3) Give the Detail
You can now give more specific detail in the body paragraphs.
When you give the detail in your body paragraphs in your IELTS writing task 1, you must make reference to the data.
The key to organizing your body paragraphs for an IELTS writing task 1 is to group data together where there are patterns.
To do this you need to identify any similarities and differences.
Look at the graph – what things are similar and what things are different?
As we have already identified in the overview, the consumption of fish and chips declined over the period, whereas the amount of pizza and hamburgers that were eaten increased.
So it is clear that pizza and hamburgers were following a similar pattern, but fish and chips were different. On this basis, you can use these as your ‘groups’, and focus one paragraph on fish and chip and the other one on pizza and hamburgers.
Here is an example of the first paragraph:
In 1975, the most popular fast food with Australian teenagers was fish and chips, being eaten 100 times a year. This was far higher than pizza and hamburgers, which were consumed approximately 5 times a year. However, apart from a brief rise again from 1980 to 1985, the consumption of fish and chips gradually declined over the 25 year timescale to finish at just under 40 times per year.
As you can see, the focus is on fish and chips. This does not mean you should not mention the other two foods, as you should still make comparisons of the data as the questions asks.
The second body then focuses on the other foods:
In sharp contrast to this, teenagers ate the other two fast foods at much higher levels. Pizza consumption increased gradually until it overtook the consumption of fish and chips in 1990. It then leveled off from 1995 to 2000. The biggest rise was seen in hamburgers, increasing sharply throughout the 1970’s and 1980’s, exceeding fish and chips consumption in 1985. It finished at the same level that fish and chips began, with consumption at 100 times a year.